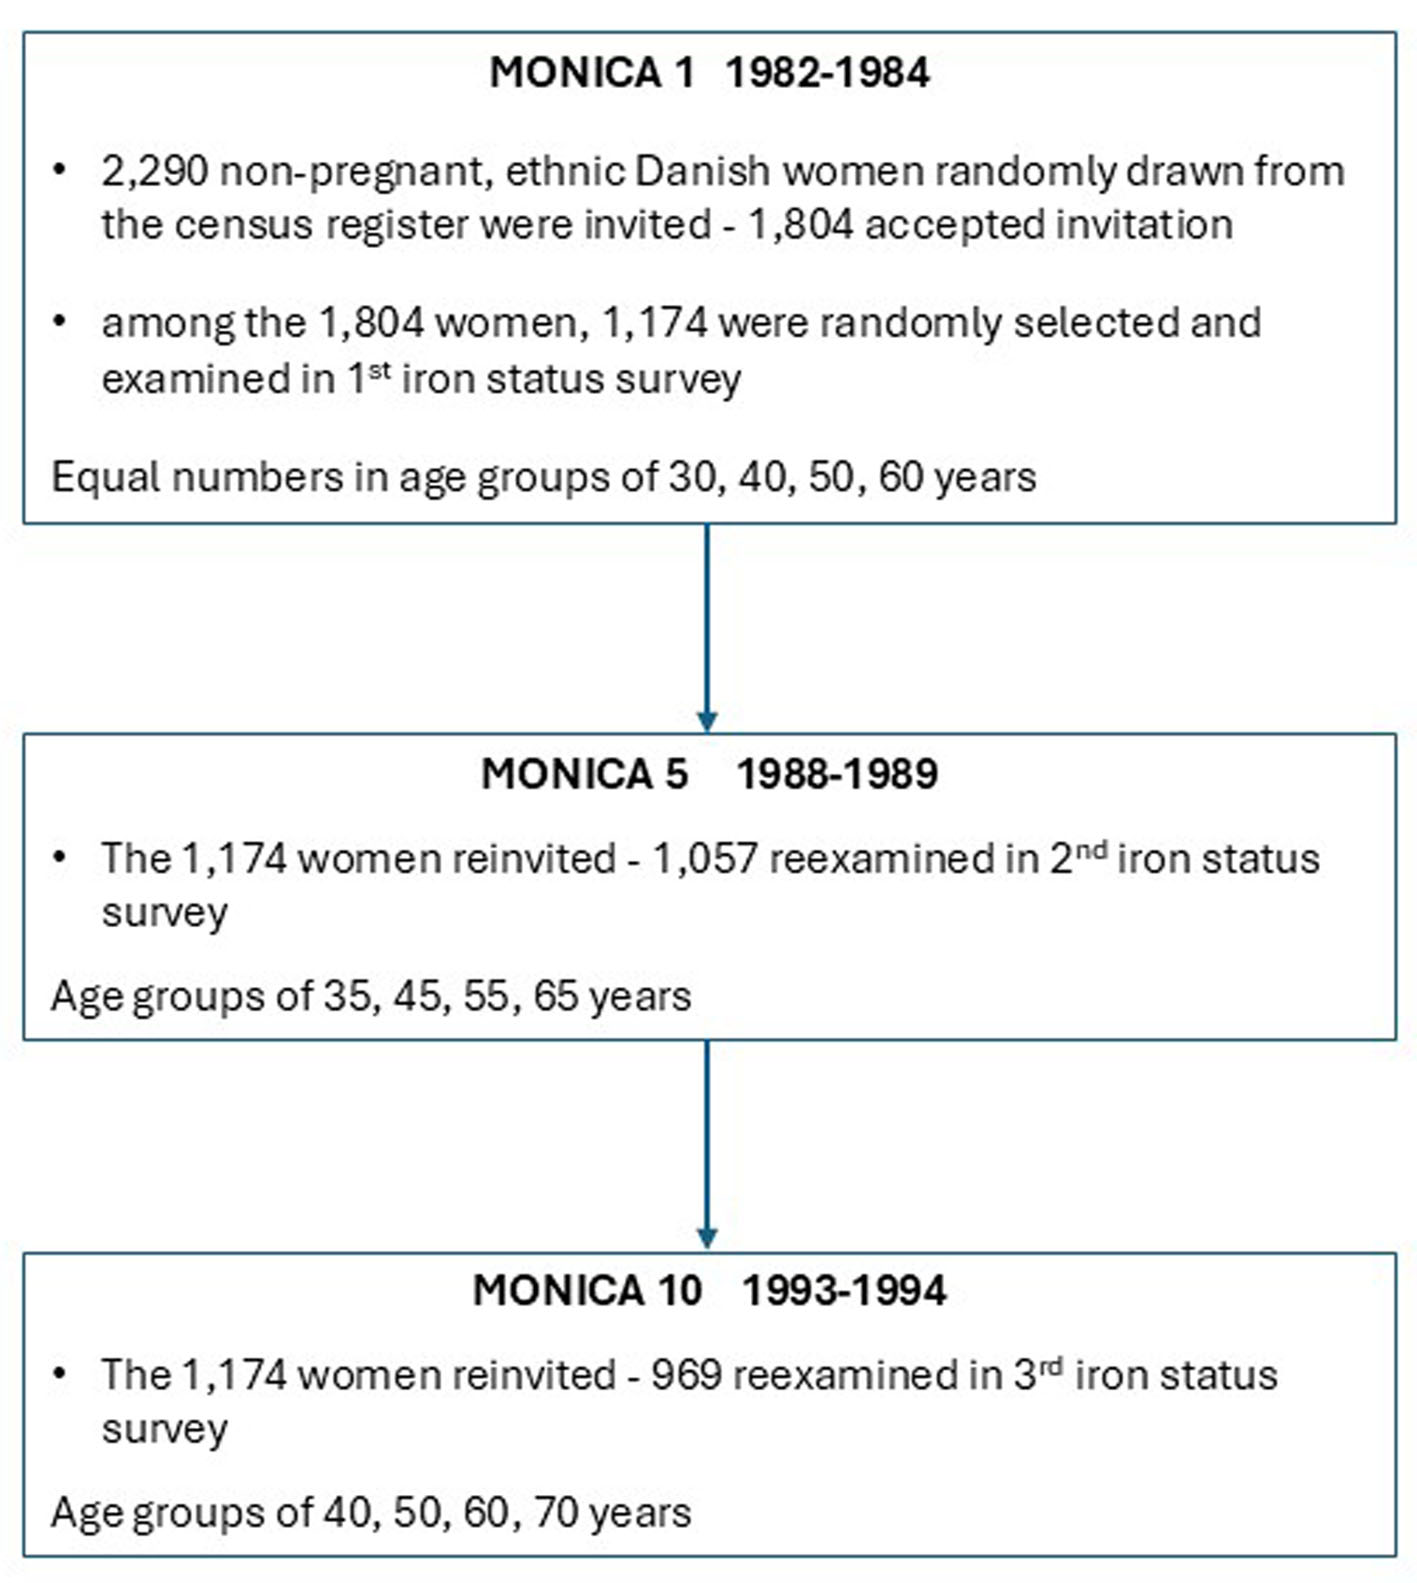
↓ Figure 1. Selection of the female participants in the longitudinal study of serum ferritin in the three MONICA surveys.
| Food Sciences and Clinical Nutrition, ISSN NoIssnPrint print, 0000-0000 online, Open Access |
| Article copyright, the authors; Journal compilation copyright, Food Sci Clin Nutr and Elmer Press Inc |
| Journal website https://fscn.elmerpub.com |
Original Article
Volume 1, 2026, e6
Age- and Time-Related Changes in Serum Ferritin Levels in Danish Women: A Population-Based Longitudinal Study of 1,174 Women Over a 10-Year Period: Influence of Nutritional Factors
Figure
Tables
| MONICA 1 (n = 1,172) 30–60 years, median 40 years | MONICA 10 (n = 969) 40–70 years, median 50 years | Wilcoxon test paired samples | |
|---|---|---|---|
| The women were examined in MONICA 1, and 969 of them in MONICA 10 as well. *Values above and below the reference interval for Danish women; Wilcoxon test paired samples compare values in women examined in both surveys. IQR: interquartile range; SD: standard deviation. | |||
| Hemoglobin, g/L | P < 0.001, n = 968 | ||
| Mean ± SD | 139 ± 10.3 | 137 ± 9.5 | |
| Median (IQR) | 139 (132–143) | 137 (132–143) | |
| Fisher’s exact test | |||
| Hemoglobin > 153 g/L*, n (%) | 55 (4.7%) | 19 (2.0%) | P = 0.0005 |
| Hemoglobin < 120 g/L*, n (%) | 31 ( 2.6%) | 25 (2.5%) | P = 0.6 |
| Hemoglobin < 120 g/L and | |||
| Ferritin < 30 µg/L, n (%) | 16 (1.4%) | 8 (0.8%) | P = 0.2 |
| Ferritin < 15 µg/L, n (%) | 14 (1.2%) | 25 (0.3%) | P = 0.026 |
| MONICA 1 (n = 1,174) 30–60 years, median 40 years | MONICA 5 (n = 1,057) 35–65 years, median 45 years | MONICA 10 (n = 968) 40–70 years, median 50 years | Wilcoxon test paired samples | Friedman test paired samples | |
|---|---|---|---|---|---|
| The women were invited for examination three times. All were examined in MONICA 1, and the majority subsequently in MONICA 5 and/or MONICA 10, i.e., all had at least two measurements of ferritin. Friedman test compares values in women examined in all three surveys. IQR: interquartile range. | |||||
| Ferritin, µg/L, median (IQR) | 48 (26–83) | 59 (36–98) | 66 (36–121) | 1 vs. 5, P < 0.0001, n = 1,057 5 vs. 10, P < 0.0001, n = 851 | P < 0.00001, n = 851 |
| Geometric mean | 44 | 60 | 65 | Chi-square test | |
| Ferritin > 200 µg/L | 38 (3.2%) | 46 (4.4%) | 83 (8.6%) | P < 0.0001 | |
| Ferritin < 30 µg/L | 351 (29.9%) | 187 (17.7%) | 185 (19.1%) | P < 0.0001 | |
| Ferritin < 15 µg/L | 146 (12.4%) | 27 (2.6%) | 48 (5.0%) | P < 0.0001 | |
| Menopausal | 447 (38.1%) | 548 (56.6%) | P < 0.0001 | ||
| Age, years | MONICA 1 | Age, years | MONICA 10 | Fisher’s exact test |
|---|---|---|---|---|
| 30 | 46/319 (14.4%) | 40 | 42/275 (15.3%) | P = 0.3 |
| 40 | 54/319 (16.9%) | 50 | 26/269 (9.7%) | P = 0.002 |
| 50 | 37/286 (12.9%) | 60 | 15/237 (6.3%) | P < 0.0001 |
| 60 | 22/250 (8.8%) | 70 | 1/188 (0.5%) | P < 0.0001 |
| 30–60 | 159/1,174 (13.5%) | 40–70 | 84/969 (8.7%) | P < 0.0001 |
| MONICA 1 (n = 159) | MONICA 5 (n = 140) | MONICA 10 (n = 166) | Wilcoxon test paired samples | Friedman test paired samples | |
|---|---|---|---|---|---|
| The women were invited for examination three times. All were examined in MONICA 1, and the majority subsequently in MONICA 5 and/or MONICA 10, i.e., all had at least two measurements of ferritin. Friedman test compares values in women examined in all three surveys. *Compared with ferritin levels in non-blood-donors in Table 5, Mann–Whitney test, P < 0.0001. IQR: interquartile range. | |||||
| Ferritin, µg/L, median (IQR) | 36 (14–56)* | 41 (27–73)* | 39 (22–77)* | 1 vs. 5, P < 0.0001, n = 140 5 vs. 10, P = 0.0001, n = 120 | P < 0.00001, n = 120 |
| Geometric mean | 31 | 44 | 41 | Chi-square test | |
| Ferritin > 200 µg/L | 6 (3.8%) | 5 (3.6%) | 7 (4.2%) | P = 0.5 | |
| Ferritin < 30 µg/L | 64 (40.3%) | 44 (31.4%) | 66 (39.8%) | P = 0.001 | |
| Ferritin < 15 µg/L | 40 (25.2%) | 4 (2.9%) | 17 (10.2%) | P = 0.001 | |
| Menopausal | 44 (27.7%) | 73 (44.0%) | P = 0.0001 | ||
| MONICA 1 (n = 1,015) | MONICA 5 (n = 917) | MONICA 10 (n = 811) | Wilcoxon test paired samples | Friedman test paired samples | |
|---|---|---|---|---|---|
| The women were invited for examination three times. All were examined in MONICA 1, and the majority subsequently examined in MONICA 5 and/or MONICA 10, i.e., all had at least two measurements of ferritin. Friedman test compares values in women examined in all three surveys. *Compared with ferritin levels in blood donors in Table 4, Mann–Whitney test, P < 0.0001. IQR: interquartile range. | |||||
| Ferritin, µg/L, median (IQR) | 52 (27–86)* | 63 (38–102)* | 73 (39–125)* | 1 vs. 5, P < 0.0001, n = 917 5 vs. 10, P < 0.0001, n = 715 | P < 0.00001, n = 715 |
| Geometric mean | 46 | 62 | 70 | Chi-square test | |
| Ferritin > 200 µg/L | 32 (3.2%) | 41 (4.5%) | 76 (9.4%) | P < 0.0001 | |
| Ferritin < 30 µg/L | 287 (28.3%) | 142 (15.5%) | 124 (15.3%) | P = 0.001 | |
| Ferritin < 15 µg/L | 106 (10.4%) | 23 (2.5%) | 32 (3.9%) | P = 0.0001 | |
| Menopausal | 403 (39.7%) | 470 (58.0%) | P < 0.0001 | ||
| MONICA 1 | MONICA 5 | MONICA 10 | Wilcoxon test paired samples | Friedman test paired samples | |
|---|---|---|---|---|---|
| The women were invited for examination three times. All were examined in MONICA 1, and the majority subsequently in MONICA 5 and/or MONICA 10, i.e., all had at least two measurements of ferritin. Friedman test compares values in women examined in all three surveys. IQR: interquartile range. | |||||
| Ferritin, µg/L, median (IQR) | 36 (23–66), n = 273 | 46 (30–68), n = 258 | 41 (25–74), n = 215 | 1 vs. 5, P < 0.0001, n = 258 5 vs. 10, P = 0.5, n = 215 1 vs. 10, P = 0.009, n = 215 | P < 0.00001, n = 218 |
| Age, years | 30 | 35 | 40 | ||
| Menopausal | 1.7% | 4.6% | |||
| Ferritin, µg/L, median (IQR) | 39 (21–69), n = 265 | 48 (29–78), n = 251 | 64 (37–110), n = 221 | 1 vs. 5, p < 0.0001, n = 251 5 vs. 10, p < 0.0001, n = 207 | P < 0.00001, n = 207 |
| Age, years | 40 | 45 | 50 | ||
| Menopausal | 6.7% | 64.3% | |||
| Ferritin, µg/L, median (IQR) | 54 (30–84), n = 249 | 82 (52–120), n = 209 | 98 (56–157), n = 203 | 1 vs. 5, P < 0.0001, n = 209 5 vs. 10, P < 0.0001, n = 163 | P < 0.00001, n = 163 |
| Age, years | 50 | 55 | 60 | ||
| Menopausal | 62.1% | 97.4% | |||
| Ferritin, µg/L, median (IQR) | 88 (50–136), n = 228 | 103 (65–146), n = 199 | 98 (61–151), n = 172 | 1 vs. 5, P = 0.0001, n =199 5 vs. 10, P = 0.2, n = 143 1 vs. 10, P = 0.0003, n = 172 | P = 0.002, n = 143 |
| Age, years | 60 | 65 | 70 | ||
| Menopausal | 98.5% | 100% | |||
| Mann–Whitney test | 30 vs. 40, P = 0.4 40 vs. 50, P = 0.0004 50 vs. 60, P < 0.0001 | 35 vs. 45, P = 0.4 45 vs. 55, P < 0.0001 55 vs. 65, P = 0.004 | 40 vs. 50, P < 0.0001 50 vs. 60, P < 0.0001 60 vs. 70, P = 0.8 | ||
| Age at examination | MONICA 1 (1984) | MONICA 10 (1994) | Mann–Whitney test |
|---|---|---|---|
| IQR: interquartile range. | |||
| 40 years | n = 265 | n = 215 | |
| Ferritin, µg/L, median (IQR) | 39 (21–69) | 42 (25–74) | P = 0.6 |
| 50 years | n = 249 | n = 221 | |
| Ferritin, µg/L, median (IQR) | 54 (30–84) | 64 (37–110) | P = 0.002 |
| 60 years | n = 228 | n = 203 | |
| Ferritin, µg/L, median (IQR) | 88 (50–136) | 98 (56–157) | P = 0.049 |
| MONICA 1, age, years | MONICA 1, BMI (kg/m2) | BMI 1 vs. ferritin | MONICA 10, age, years | MONICA 10, BMI (kg/m2) | BMI 10 vs. ferritin | BMI 1 vs. BMI 10* | MONICA 10, BMI ≥ 25 kg/m2 | BMI 10 ≥ 25 kg/m2 vs. ferritin |
|---|---|---|---|---|---|---|---|---|
| *Mann–Whitney test. BMI: body mass index; SD: standard deviation; rs: Spearman’s correlation coefficient. | ||||||||
| 30 (n = 305) | 23.8 ± 3.9 | rs = 0.03 P = 0.6 | 40 (n = 323) | 24.1 ± 4.2 | rs = −0.03 P = 0.7 | P < 0.0001 | 93/323 (28.8%) | rs = −0.03 P = 0.8 |
| 40 (n = 285) | 25.6 ± 4.6 | rs = −0.01 P = 0.9 | 50 (n = 331) | 25.7 ± 4.9 | rs = −0.02 P = 0.8 | P = 0.8 | 150/331 (45.3%) | rs = 0.05 P = 0.5 |
| 50 (n = 281) | 26.2 ± 4.5 | rs = 0.06 P = 0.4 | 60 (n = 318) | 26.2 ± 4.4 | rs = 0.15 P = 0.008 | P = 0.9 | 180/318 (56.6%) | rs = 0.02 P = 0.8 |
| 60 (n = 216) | 25.8 ± 4.4 | rs = 0.09 P = 0.2 | 70 (n = 238) | 25.8 ± 4.4 | rs = 0.05 P = 0.4 | P = 0.9 | 124/238 (52.1%) | rs = 0.11 P = 0.3 |
| 30–60 (n = 1,028) | 25.3 ± 4.4 | rs = 0.07 P = 0.03 | 40–70 (n = 1,210) | 25.5 ± 4.6 | rs = 0.12 P < 0.0001 | P = 0.3 | 547/1,210 (45.2%) | rs = 0.03 P = 0.3 |
| Mann–Whitney test | 30 vs. 40 years: P = 0.1 40 vs. 50 years: P = 0.02 50 vs. 60 years: P = 0.3 | 40 vs. 50 years: P < 0.0001 50 vs. 60 years: P = 0.02 60 vs. 70 years: P = 0.3 | ||||||